This guide presents the global methodology for estimating market size, transforming raw data into actionable investment insights, with a focus on smart solutions to overcome data scarcity challenges in emerging markets across the Middle East and North Africa.
Market Sizing (TAM/SAM/SOM): How to Analyze Your Market Professionally in the Arab Region
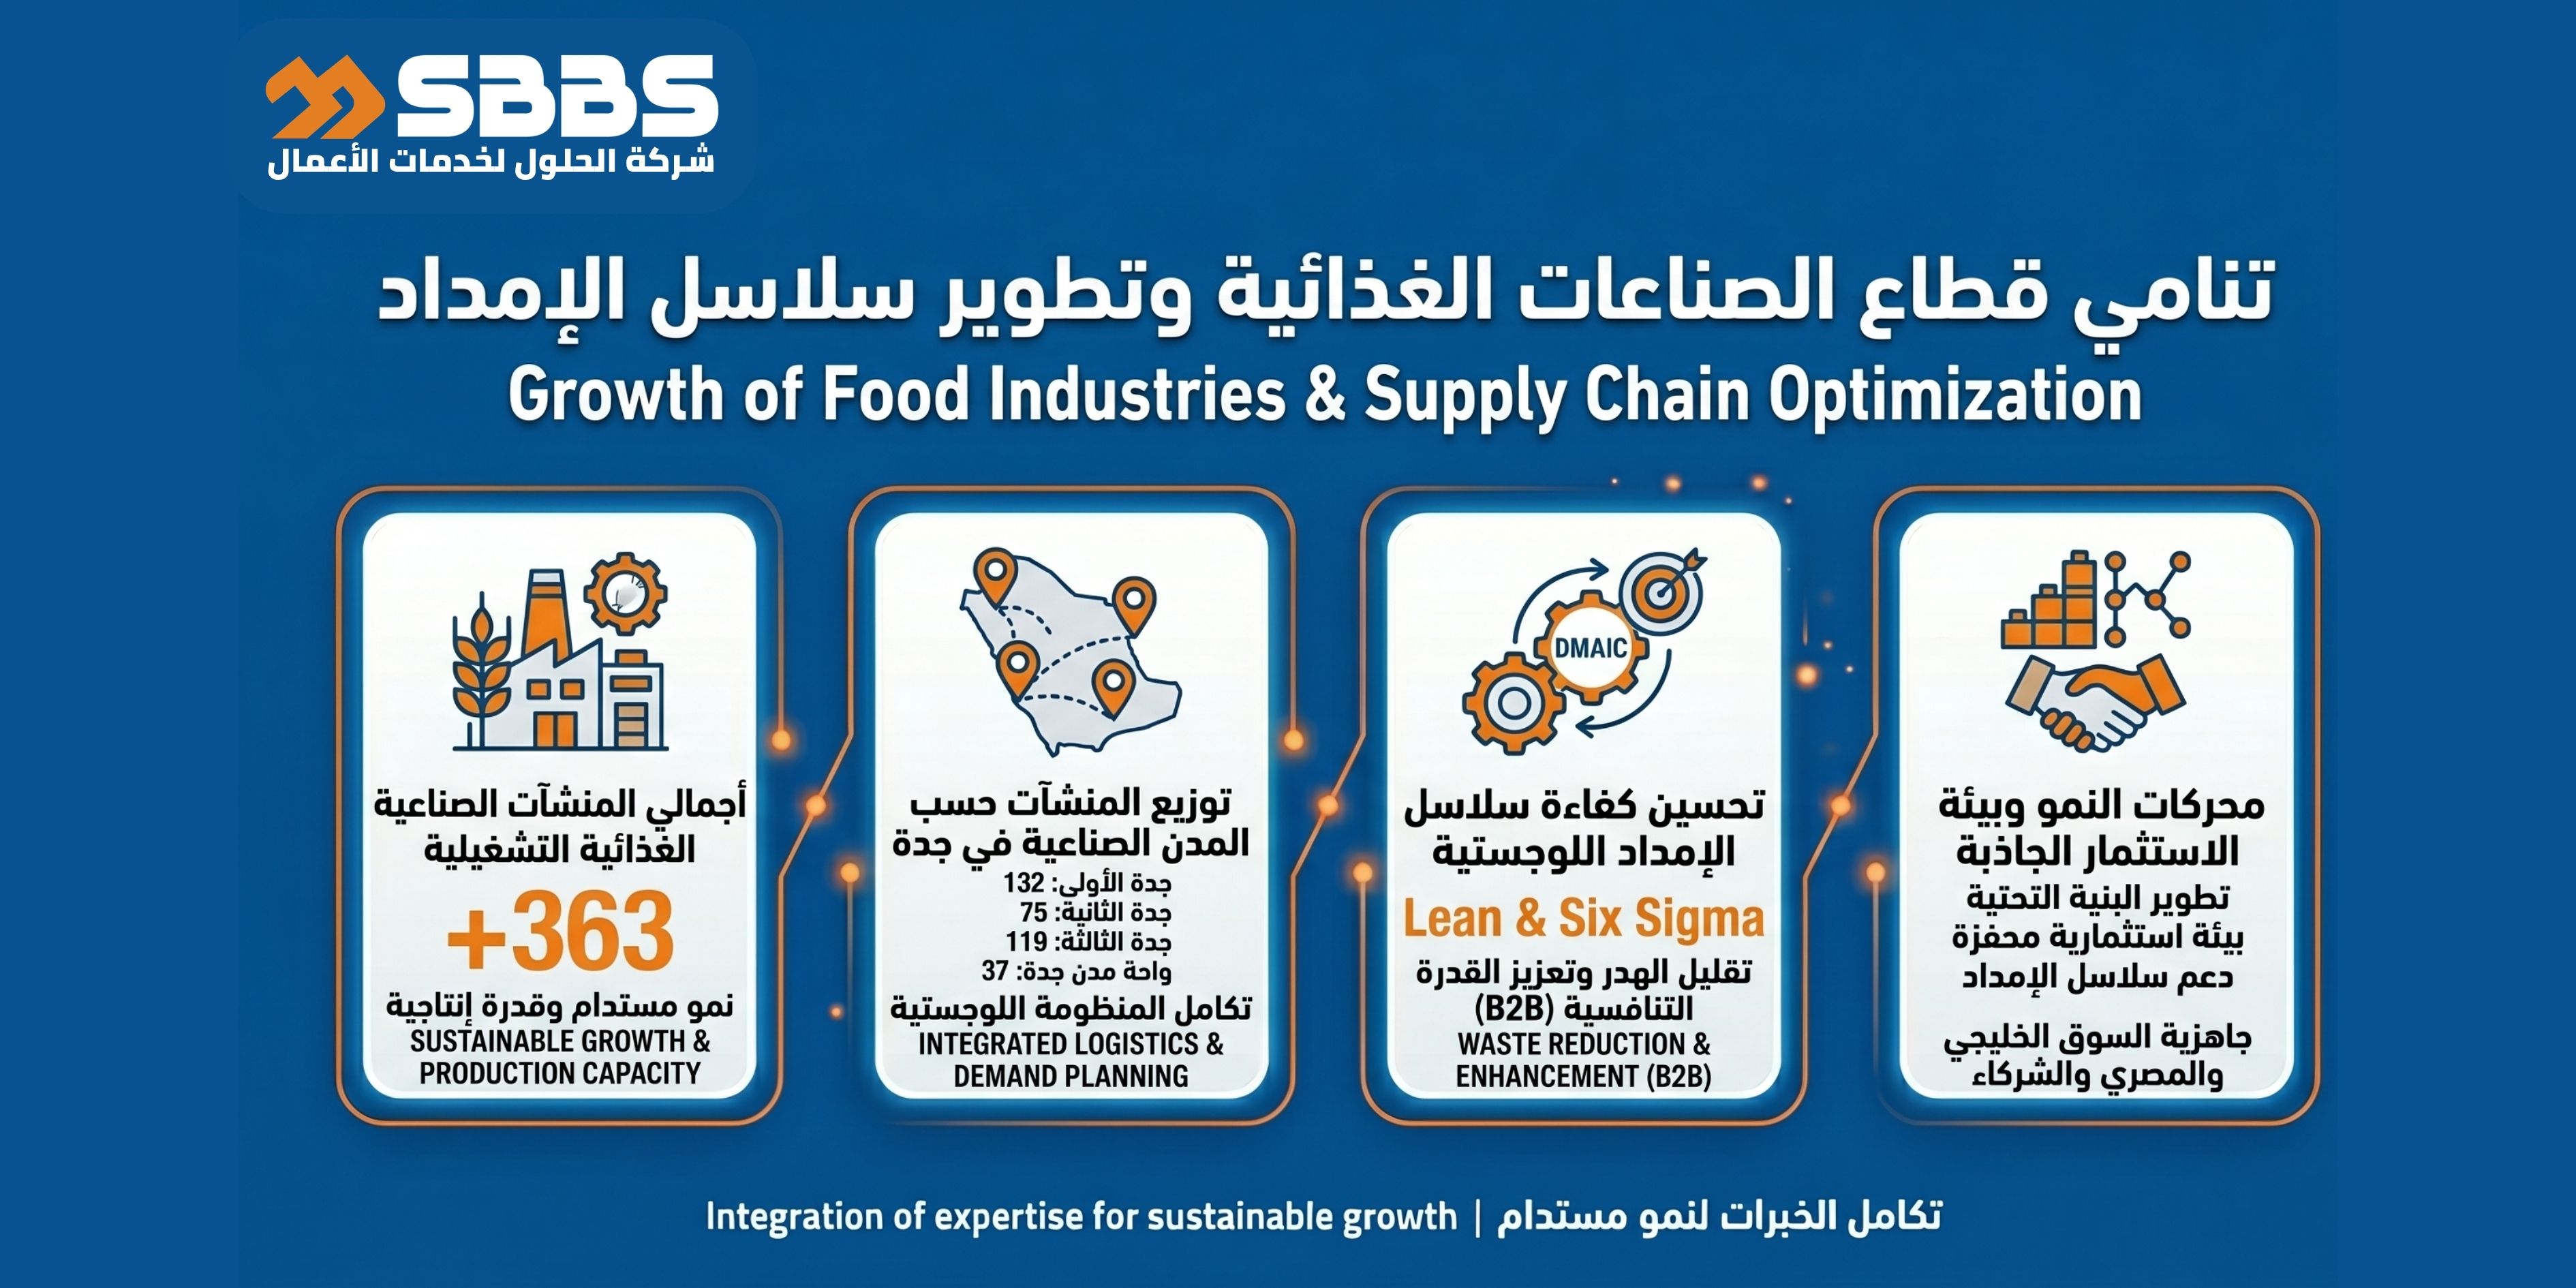
Executive Summary
Estimating market size is the biggest challenge in any market feasibility study.
Without accurate figures reflecting demand and competition, financial projections remain mere guesses.
This guide presents the global TAM/SAM/SOM methodology adapted to the Arab market, offering practical solutions to overcome the lack of statistical data in certain countries. It helps investors identify realistic market share and forecast growth rates for their projects.
Glossary of Terms
| Term |
Brief Description |
| TAM (Total Addressable Market) |
The maximum revenue your product could achieve if there were no competitors. |
| SAM (Serviceable Addressable Market) |
The portion of the market you can actually reach geographically. |
| SOM (Serviceable Obtainable Market) |
The share you realistically expect to capture given competition. |
| Proxy Data |
Using indirect figures to estimate market size. |
| Import-Based Analysis |
Estimating market size based on import statistics. |
1. Arab Market Context: Data Challenges and Opportunities
Market research strategies differ according to data maturity:
-
Gulf countries: Accurate official data from national statistics and POS systems allows number-based estimations.
-
Levant & North Africa: Heavier reliance on informal economy and import/export data (e.g., UN Comtrade) to estimate consumption gaps.
2. TAM / SAM / SOM Methodology in Practice
A professional market feasibility study divides the market into three layers:
1. Total Addressable Market (TAM)
The maximum potential revenue if there were no competitors.
2. Serviceable Addressable Market (SAM)
The portion of TAM your business can realistically reach based on operational model and geographic presence.
3. Serviceable Obtainable Market (SOM)The most important figure for investors, representing your realistic market share amid competitors.
3. Estimating Market Size in Data-Scarce Environments
In countries lacking updated statistics, Proxy Data is used:
-
Import analysis: Customs figures reflect actual demand.
-
Internet usage intensity: For digital products, tools like Google Keyword Planner estimate search volume.
-
Benchmarking: Compare with economically similar countries, adjusting for population and purchasing power.
4. Financial Link: How Market Size Affects NPV
Market feasibility is incomplete without financial integration.
Accurate SOM estimation directly impacts:
5. Efficiency Levers in Market Analysis
-
AI tools: Analyze customer sentiment and trends (Sentiment Analysis).
-
Dashboards: Convert complex market figures into visual insights for decision-making.
-
Digital surveys: Collect primary data from target audiences via social media.
6. Reliable Regional Data Sources (2020–2026)
-
ITC Trade Map: Track goods flows between Arab countries.
-
Statista: Data on consumer and tech sectors.
-
Government portals: e.g., Egypt Statistics Portal, Saudi Data Platform.
-
GS1: Consumer goods movement (FMCG) data.
Case Study: Bottled Water Factory in Jordan
-
Challenge: Saturated market with outdated official data.
-
Methodology: Used Proxy Data—population of target areas × average daily water consumption (WHO data).
-
Result: Identified a niche for eco-friendly bottles, enabling SOM of 8% in year one, achieving ROI 14 months faster than traditional estimates.
Checklist for Market Sizing
-
Have you defined your ideal customer accurately?
-
Are data sources less than 3 years old?
-
Did you account for major competitors when calculating SOM?
-
Have you considered seasonality (e.g., Ramadan, summer)?
-
Did you verify disposable income in your target region?
-
Conducted field interviews with at least 3 distributors or retailers?
-
Is your market model updateable when a new competitor enters?
Common Market Analysis Mistakes
-
The 1% trap: Claiming “I’ll take 1% of China’s market” without explaining how.
-
Confusing TAM & SAM: Presenting global market size while your project is local.
-
Ignoring product substitutes: Competition includes any solution fulfilling the same need (e.g., juice vs. bottled water).
Key Takeaways
-
Data is never a barrier: alternative sources exist (imports, surveys, benchmarking).
-
Investors focus on SOM: highlight realistic market share.
-
Markets are dynamic: update market feasibility every 6 months.
-
Localization is key: understand consumption culture in each Arab country.
-
Quality over quantity: one verified number is better than ten random figures.
7-Point Action Plan for Estimating Your Market
-
Define TAM: start with large figures from global industry reports.
-
Narrow down SAM: specify city or age segment.
-
Analyze competition: list top 5 competitors and estimate their shares.
-
Calculate SOM: be conservative in your first-year estimate.
-
Conduct surveys: simple polls via LinkedIn or Facebook.
-
Check pricing: ensure competitiveness versus market rates.
-
Document sources: include links in an appendix to enhance credibility.
References
-
World Bank – World Development Indicators (2025)
-
Euromonitor International Reports on Middle East Markets
-
GCC Statistical Center – Unified Economic Bulletins
Share Article
https://mail.sbbserv.com/en/blog/38